

LLM-Assisted Development vs. Agentic AI
What I Built, What It Is, What It Isn’t ... and What It Would Look Like If We Went All the Way

Someone Asked Me About Their “Agent”
A researcher reached out to me recently and asked what I thought about their agent. They’d built something impressive: a tool that pulled data, ran some processing, and generated a report. They were excited about it. And they should have been. It was genuinely cool work.
But it wasn’t an agent.
I explained what I thought it was and what it wasn’t. Not to diminish the work, because the work was solid … but because in this space, precision with language matters. When everyone calls everything an agent, the term loses meaning. And when the term loses meaning, decision-makers stop trusting it. That’s bad for all of us.
Now, for the sake of not throwing that project under the bus, I asked if I could develop my own example to illustrate the distinction. Build something real, walk through what it actually is under the hood, and then show what the fully agentic version would look like.
So here’s a talk on LLM-Assisted Development vs. Agentic AI to help you understand the difference.
Both are valuable. Both serve different purposes. One is not better than the other, they solve different problems at different levels of autonomy. The goal of this article is to make sure you know which one you’re building and can articulate why.
The Build: From Static Table to Interactive Sprint Intelligence
Baseball Savant is one of the best public sports data platforms ever built. MLB’s Statcast system tracks every competitive run in real time and publishes sprint speed data, home-to-first times, and critically 90-foot split data at 5-foot intervals for hundreds of players. It’s free. It’s detailed. It’s extraordinary.

But it’s a table. A very good table, but a table. And tables don’t move. They don’t tell you the shape of a player’s acceleration. They don’t show you where Trea Turner separates from Elly De La Cruz. They don’t let a coach or scout see the race.
So I built BOLT , a 90ft Sprint Intelligence Lab. Same Statcast data. Completely different delivery.
Here’s what it does:
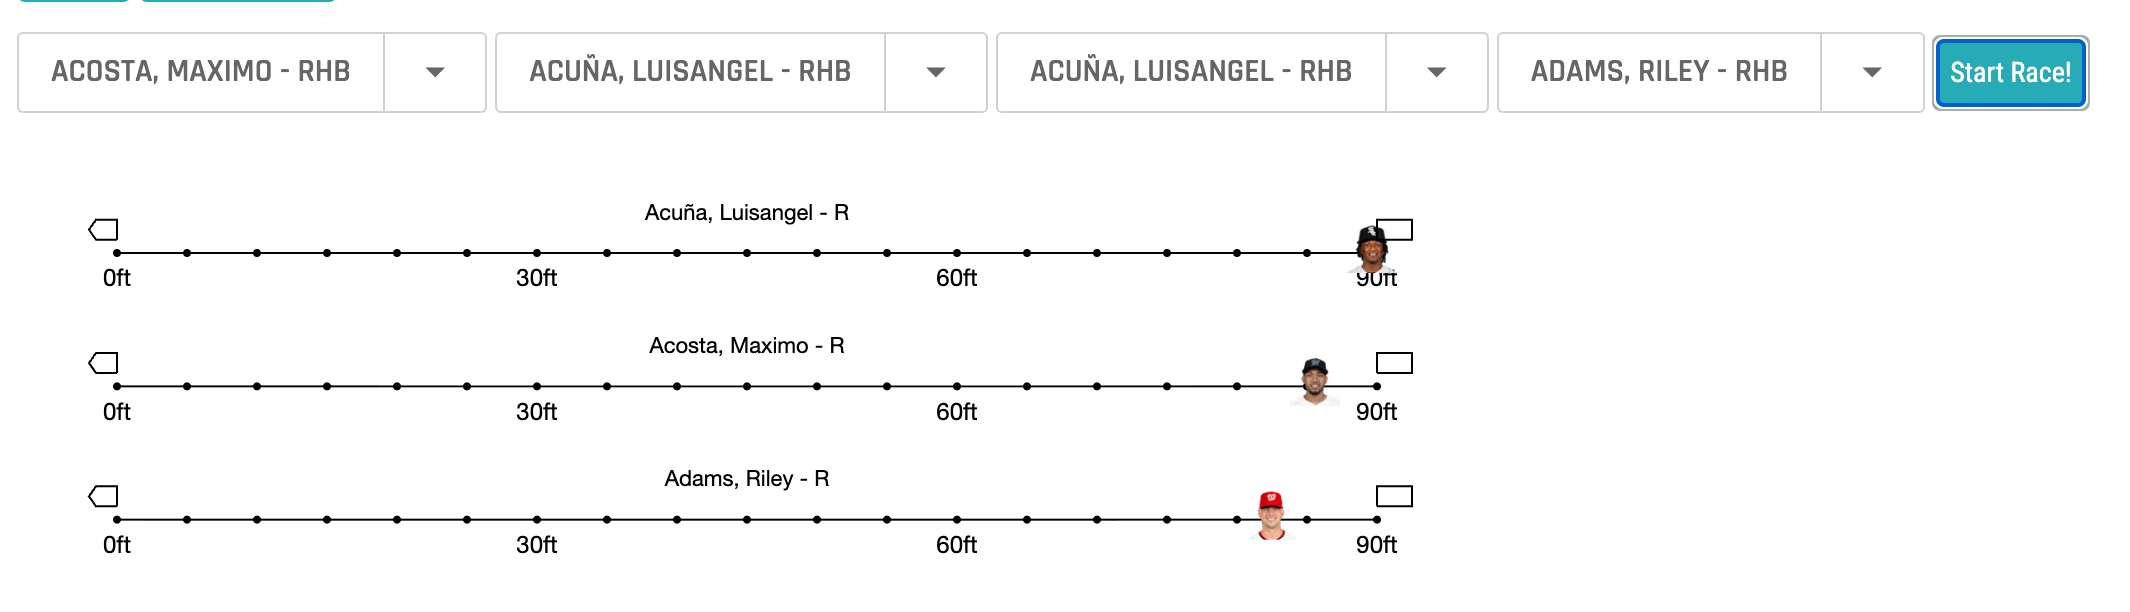
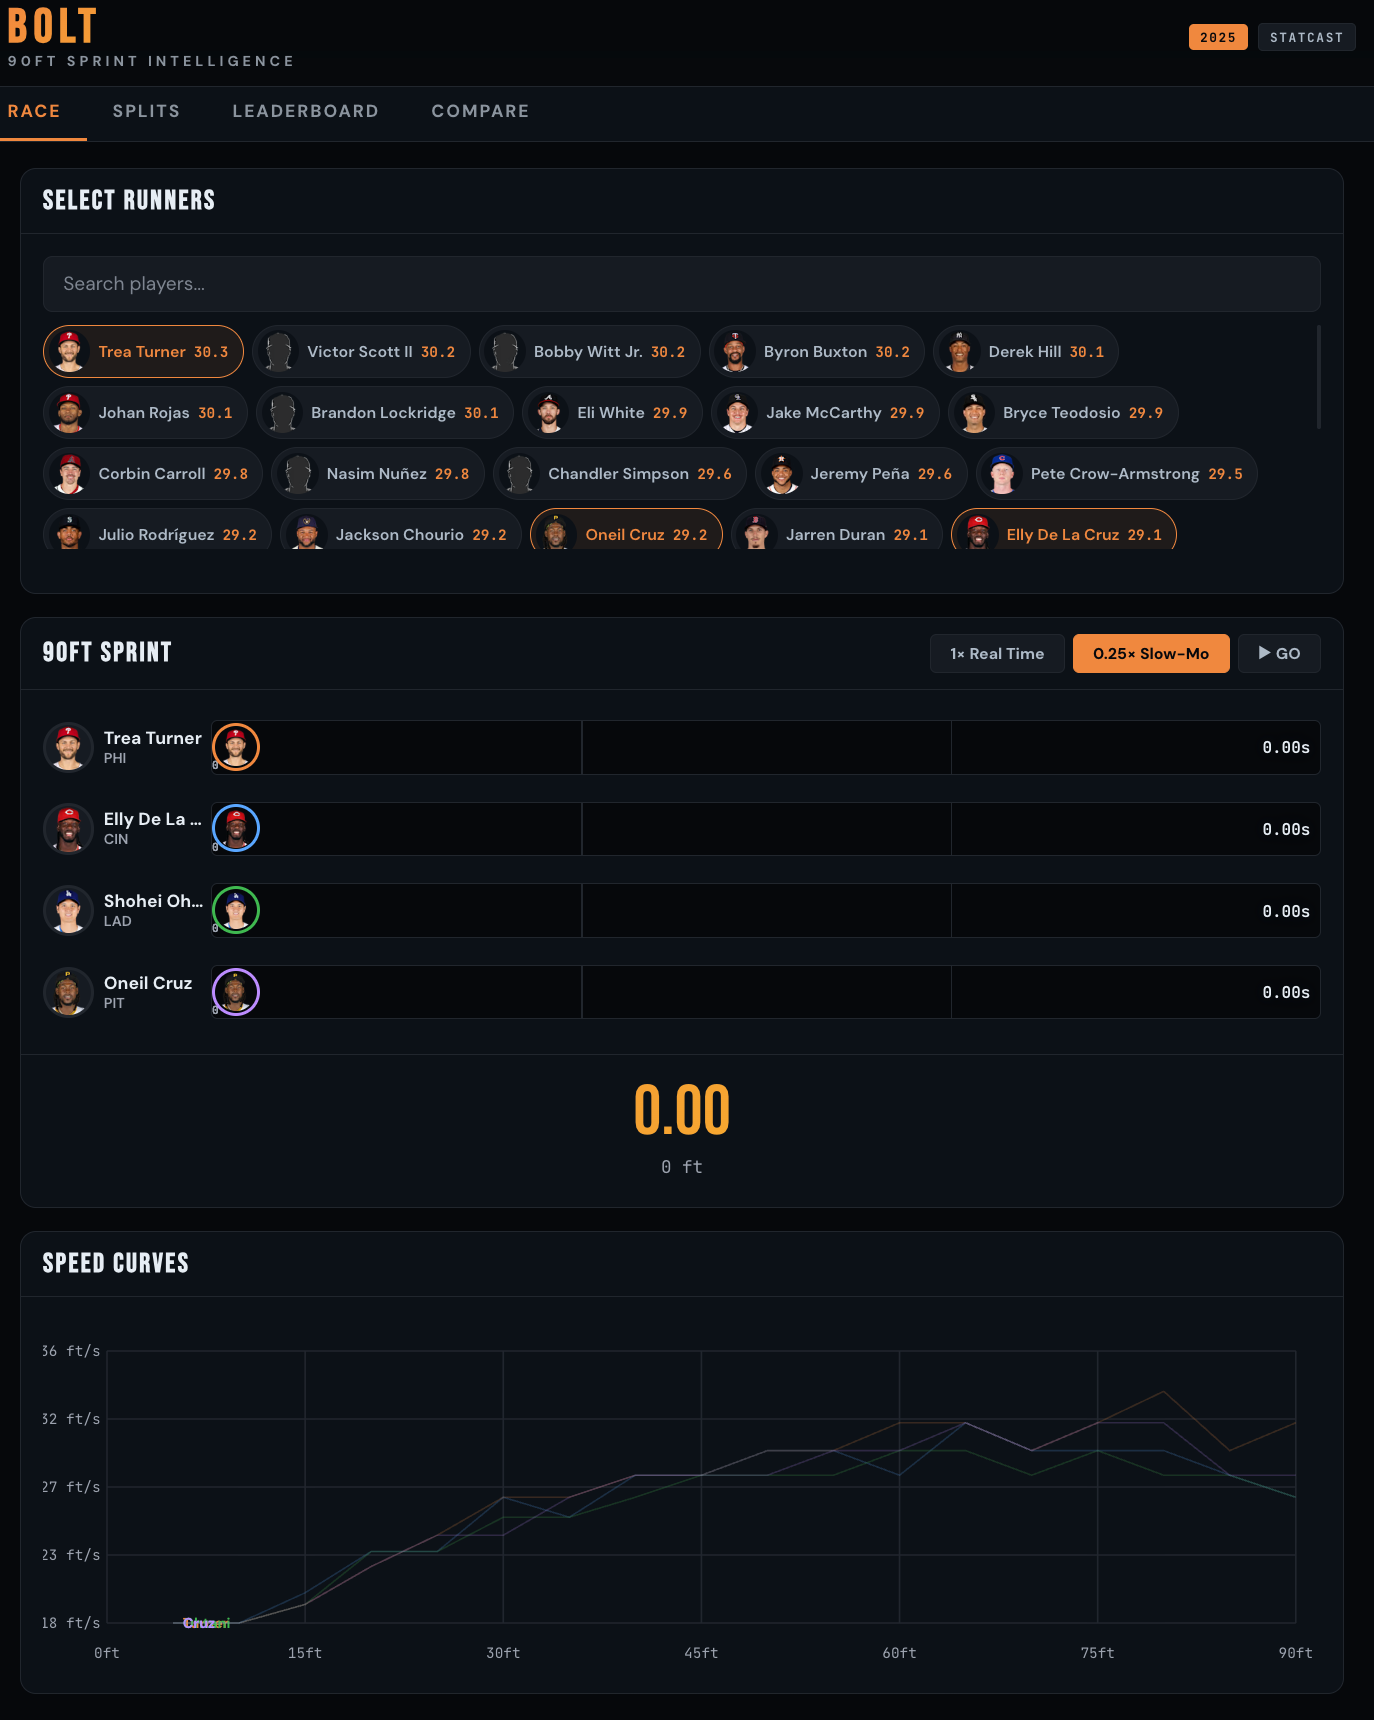
Race Panel: Select up to 6 players and watch them sprint 90ft head-to-head in real time (or 0.25× slow motion) using their actual split data. Player headshots animate down the basepath. When each runner crosses 90ft, their time freezes. After the race, the lanes reshuffle into finish order with a smooth CSS animation.
Speed Curves: The chart below the race animates simultaneously, revealing each runner’s speed profile in real time. You see acceleration curves drawing as the race unfolds … who explodes out of the box, who builds top-end speed late.
Scout Engine Report: After the race, a scouting report generates on the fly with a typewriter animation. It analyzes the winner’s acceleration profile, where they gained separation, their positional ranking and percentile, and the margin of victory in feet.
Splits Panel: Overlay any players’ acceleration curves. Speed (ft/s) at every 5ft interval from 0–90ft. Max speed points highlighted. Full split comparison tables.
Leaderboard: All players ranked by sprint speed, filterable by position. Beeswarm chart showing speed distribution by position.
Compare: Pick two players. Monte Carlo simulation runs 10,000 races with variance modeling. Posterior histogram: “Player A beats Player B X% of the time.” Full stat breakdown.
One HTML file. Mobile-optimized. Built in a single working session with Claude.
Let’s Be Honest About What This Is
Here’s where I need to be precise, because this is the part most people in this space get wrong.
BOLT was built using LLM-assisted development. That means:
I prompted. Claude built. I reviewed. I gave feedback. Claude iterated. I prompted again. The human was in the loop at every single decision point.
The “Scout Engine” report that generates after each race? It’s template-driven narrative generation. Deterministic JavaScript logic that takes race results and produces structured prose. It is not making a live LLM API call. There is no model inference happening at runtime. The text looks like AI output because it’s well-written and contextual, but it’s algorithmic string construction with domain-specific logic.
Let me map this precisely onto the taxonomy:
Table 1: Taxonomy of what’s what
The build methodology: Conversational prototyping. An analyst with domain expertise treating an LLM as a pair-programmer with infinite patience, iterating in real time. “The times are all showing 4.19” → fix. “The text is too dim” → fix. “Add a post-race animation with an LLM report” → done. That iterative human-in-the-loop cycle IS the methodology.
This isn’t prompt engineering. It’s not agents. It’s a workflow category that doesn’t have a clean name yet … and people like us are defining it through our builds.
Why This Still Matters (Even Though It’s Not Agentic)
I want to be clear: LLM-assisted development is not a lesser category. It’s not “just prompting.” What happened in this build session represents a fundamental shift in who can build interactive analytical products and how fast.
I spent seven years in MLB R&D. I know exactly how long it used to take to go from “I see interesting data on Savant” to “there’s an interactive tool in front of a coach.” The answer was weeks. Sometimes months. You needed a front-end developer, a designer, a data engineer, QA, deployment infrastructure.
BOLT was conceived, designed, built, debugged, and polished in one afternoon. Same data. Same analytical depth. But the gap between having insight and delivering insight collapsed from weeks to hours.
That’s the story. Not “I built an agent.” The story is: the last mile of analytics delivery just got obliterated.
Three principles that make this work:
1. Make it visual. A race is more intuitive than a row in a table. Humans process motion and relative position faster than numbers. The same split data that lives in 19 columns on Savant becomes a story when you animate it. (Please note, in Figure 2 we show that Savant does have a racing tool, this just went a few steps further for illustration).
2. Make it interactive. Let people explore on their own terms. A coach doesn’t want my pre-selected comparison. They want to type “Byron” and see Buxton race against the guy they’re thinking about acquiring.
3. Make it narrated. Auto-generated analysis turns numbers into decisions. The Scout Engine report doesn’t just say who won, it says where they won, how they won, and what that means positionally.
Your stakeholders don’t want a CSV. They want to see the race, read the report, and make a call.
Now Let’s Go All the Way: What Agentic BOLT Would Actually Look Like
Everything above was human-in-the-loop. Every prompt, every iteration, every decision was mine. The LLM was a powerful collaborator, but I was the orchestrator.
So what would it look like if we removed the human from the loop and let an autonomous system handle the full pipeline? Here’s the architecture for a truly agentic version of BOLT, designed on Anthropic’s stack.
Architecture Overview
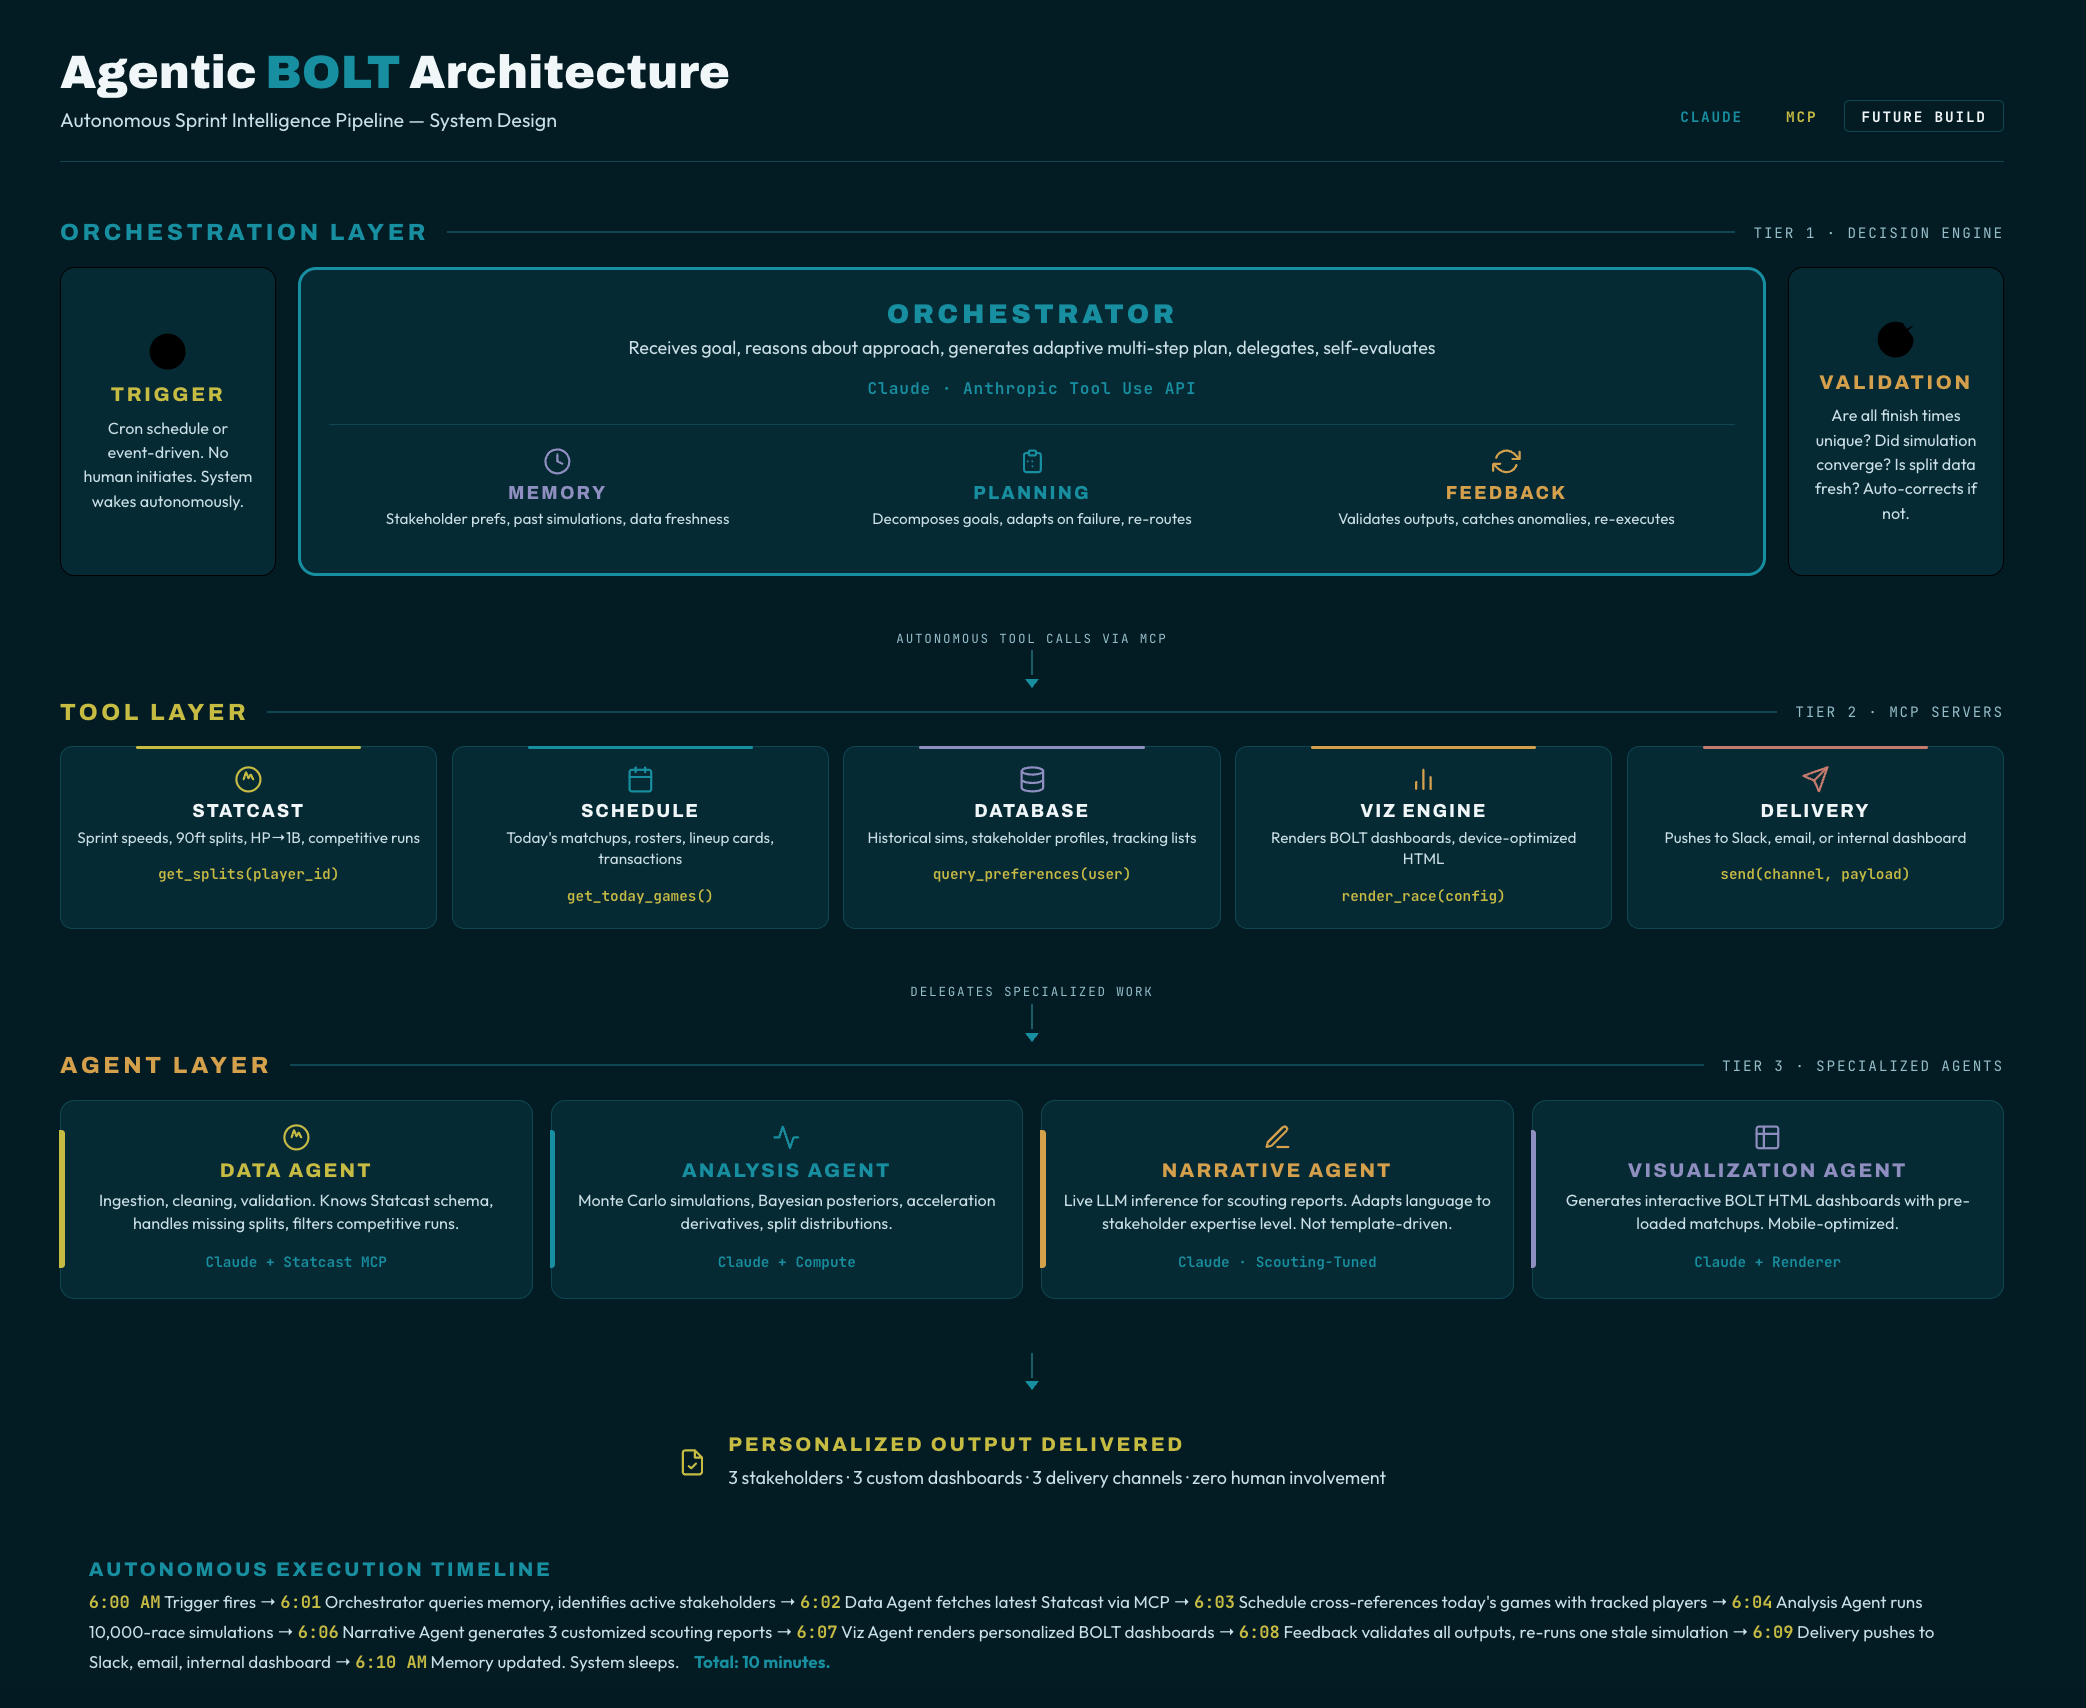
The system would use Claude as the orchestrator LLM with access to tools via Anthropic’s tool use API and Model Context Protocol (MCP). Here’s how each component maps to the agentic framework:
1. Orchestrator: Claude with Tool Use
The central Claude instance acts as the brain. It receives a high-level goal (“Generate today’s sprint intelligence report for the Tampa Bay Rays front office”) and autonomously plans a sequence of actions. No human tells it which tools to use or in what order. It reasons about the goal, decomposes it into subtasks, and delegates.
Key distinction from BOLT: In the current build, I told Claude “build me a race visualization.” In the agentic version, Claude decides on its own that a race visualization is the right deliverable for this stakeholder based on their role, preferences, and the data available.
2. Planning Module
Before executing anything, the orchestrator generates a multi-step plan:
Step 1: Fetch latest sprint speed data from Baseball Savant via MCP server
Step 2: Fetch 90ft split data for all available players
Step 3: Identify notable matchups (biggest speed differential on the upcoming schedule, recent callups, IL returns with speed changes)
Step 4: Query memory for this stakeholder’s previous interests and preferences
Step 5: Generate race simulations for the 3 most relevant matchups
Step 6: Write scouting reports via live LLM inference (not template-driven)
Step 7: Compile into interactive dashboard and push to delivery channel
Step 8: Log results to memory, await feedback
Key distinction: This plan is generated by the model, not hardcoded. If the Savant API is down, the orchestrator autonomously re-plans, perhaps falling back to cached data or adjusting the deliverable scope. If it discovers a player was just traded, it adjusts the matchups. The plan is adaptive.
3. Tool Use: MCP Servers
The orchestrator has access to a suite of tools via MCP (Model Context Protocol), Anthropic’s open standard for connecting LLMs to external systems:
Statcast MCP Server: A custom MCP server that wraps the Baseball Savant API. Exposes tools like get_sprint_speeds(season, min_runs), get_90ft_splits(player_id), get_hp_to_first(player_id, date_range). The orchestrator calls these tools autonomously based on what data it needs.
MLB Schedule MCP Server: Fetches today’s matchups, rosters, lineup cards. The orchestrator uses this to identify which speed matchups are relevant right now.
Database MCP Server: Reads and writes to a persistent PostgreSQL store. Historical race simulations, stakeholder preferences, player tracking lists. This is the memory layer.
Visualization MCP Server: Takes structured data and generates the interactive HTML artifacts. The orchestrator passes race results and receives a rendered BOLT dashboard.
Delivery MCP Server: Pushes the final product to Slack, email, or an internal dashboard. The orchestrator chooses the channel based on stakeholder preferences stored in memory.
Key distinction: In the current BOLT, I manually copied data from Savant and pasted it into the conversation. In the agentic version, the system fetches live data on its own, decides what’s relevant, and never needs a human to provide the raw inputs.
4. Memory: Persistent Context
The agentic system maintains persistent memory across sessions:
Stakeholder profiles: “Coach Martinez prefers sprint comparisons for outfielders. Last week he asked about Buxton vs. Carroll. He views reports on mobile.”
Historical simulations: “On Feb 14, we simulated Turner vs. Simpson 10,000 times. Turner won 34.2%. Store this so we can track if the distribution shifts with new data.”
Data freshness tracking: “Sprint speed data was last pulled 6 hours ago. Splits data is from yesterday. Schedule data is stale — trigger refresh.”
Key distinction: Current BOLT has no memory. Every session starts from zero. The agentic version remembers who you are, what you’ve asked for before, and how the data has changed since your last interaction.
5. Feedback Loop: Self-Evaluation
After generating a report, the orchestrator evaluates its own output:
“Does the scouting report reference the correct acceleration profile for this player?”
“Is the Monte Carlo simulation using sufficient sample size for statistical significance?”
“Did I account for the fact that this player bats left-handed and therefore starts closer to first base?”
If any check fails, the orchestrator re-plans and re-executes autonomously. No human flags the error. The system catches it, corrects it, and re-delivers.
Key distinction: When BOLT’s race showed all times as 4.19s, I caught the bug and told Claude to fix it. In the agentic version, the system would run validation checks (are all finish times identical? → flag anomaly) and self-correct.
6. Multi-Agent Delegation
For complex deliverables, the orchestrator delegates to specialized sub-agents:
Data Agent (Claude + Statcast MCP): Handles all data ingestion, cleaning, and validation. Knows the Statcast schema, handles edge cases like incomplete split data, filters for competitive runs.
Analysis Agent (Claude + compute tools): Runs Monte Carlo simulations, computes acceleration derivatives, generates Bayesian posterior distributions.
Narrative Agent (Claude, tuned for scouting language): Writes the scouting reports. Not template-driven, this is live LLM inference that produces natural, contextual prose adapted to the stakeholder’s expertise level.
Visualization Agent (Claude + rendering tools): Generates the interactive HTML dashboard, optimized for the stakeholder’s preferred device and viewport.
These agents communicate via a multi-agent protocol. The Data Agent passes cleaned datasets to the Analysis Agent. The Analysis Agent passes race results to the Narrative Agent. The Narrative Agent passes the report to the Visualization Agent. The orchestrator coordinates all of it and assembles the final deliverable.
The Full Flow
6:00 AM — Trigger: Cron job fires. Orchestrator wakes up.
6:01 AM — Plan: Orchestrator queries memory for active stakeholders. Identifies 3 coaches with sprint intelligence subscriptions.
6:02 AM — Data Agent: Fetches latest Statcast data via MCP. Identifies 12 new competitive runs since last pull. Cleans and validates.
6:03 AM — Schedule Agent: Today’s games: TB vs NYY, PHI vs LAD, HOU vs SEA. Cross-references with each coach’s tracked players.
6:04 AM — Analysis Agent: Runs 10,000-race simulations for 6 relevant matchups. Computes updated posteriors.
6:06 AM — Narrative Agent: Generates 3 customized scouting reports. Coach Martinez gets outfield focus. Coach Williams gets baserunning analysis. The GM gets league-wide speed trends.
6:07 AM — Visualization Agent: Renders 3 personalized BOLT dashboards with pre-loaded matchups.
6:08 AM — Feedback: Orchestrator validates all outputs. Catches one simulation using stale split data → re-runs with fresh data.
6:09 AM — Delivery: Pushes to Slack (Martinez), email (Williams), internal dashboard (GM).
6:10 AM — Memory: Logs all results. Updates stakeholder interaction history. Sleeps until next trigger.
Total time: 10 minutes. Zero human involvement.
That’s agentic AI. The LLM isn’t assisting a human. The LLM is the decision-maker, and it’s coordinating multiple specialized systems to deliver a personalized product on a schedule.
That researcher’s project I mentioned at the top? It lived somewhere between the LLM Chatbot column and RPA. Impressive work, genuinely. But calling it an agent would have undersold what agents actually require, and oversold what their system actually did. Naming it correctly doesn’t diminish it. It sharpens it.
The Real Takeaway
The point of this article isn’t that one approach is better than the other. It’s that you need to know which one you’re building and why.
LLM-Assisted Development is where 90% of the value is right now. If you’re an analyst, a researcher, a student … the ability to go from data to interactive product in one session is transformative. You don’t need agents for that. You need domain expertise, a good LLM, and the willingness to iterate.
Agentic AI is where the field is heading for production systems. When you need autonomous, scheduled, personalized delivery at scale, when a human can’t be in the loop for every decision, that’s when the orchestrator-planner-tool-memory-feedback architecture earns its complexity.
Most people building today are in category one and calling it category two. That’s not a crime. But it’s imprecise. And in a field moving this fast, precision is what separates thought leaders from hype merchants.
Know what you built. Name it correctly. And if you want to go all the way, now you have a blueprint!
A note for those applying to jobs: This matters for your career too. When you're in an interview and someone asks what you built, be precise. If you used an LLM to help you write code faster, say that, don't call it an agent. If you built a RAG pipeline, call it retrieval-augmented generation, don't call it agentic. If you built a chatbot with a system prompt, own it for what it is. Hiring managers who know the difference will respect your precision. Hiring managers who don't know the difference need you to teach them. Either way, you win by naming it correctly. Overselling what you built doesn't just hurt your credibility when someone digs deeper, it tells the room you don't actually understand the architecture you're describing. Know what you built. Know what it's called. Know why it matters at that level. That's what gets you hired.
What’s Next
BOLT joins the Athlyticz interactive app series alongside Diamond Shift (defensive positioning), IceVision (NHL shot mapping), PitchLab (pitch movement modeling), and ARC (basketball shot analytics). Each one is built the same way; public data, LLM-assisted development, single-session delivery, followed by full agentic versions.
Next up: I’m building the agentic version of BOLT. For real. The Statcast MCP server, the multi-agent pipeline, the scheduled delivery.
If you want to follow along I offer weekly sessions centered around these public builds.
About the Author
Michael S. Czahor, PhD
Sports Analytics Expert | Data Science Educator | Founder, Athlyticz
Michael spent seven years in Major League Baseball R&D building probabilistic forecasting systems and prototyping the interactive applications that put analytics into the hands of coaches, scouts, and executives.
Now, as Founder of Athlyticz, he trains the next generation of analysts through applied, real-world sports case studies. The platform reaches students and professionals across 15+ countries, with instruction spanning R, Python, Bayesian modeling, AI/LLM workflows, and Shiny development.
He builds things that work and teaches others to do the same.
Subscribe for more deep dives on modern data science workflows, AI-assisted development, and the craft of building things that matter.
I also offer private workshops that go in to much further detail.
Finally, AthlyticZ offers a wide range of services to supercharge your data science teams. Check out our revamped site and book a call to work with our experts.